CASE STUDY · SPACEWALK AI · CISO DASHBOARD
Should Spacewalk sell up to the CISO?
In six weeks, I designed an executive security dashboard from scratch and put it in front of Fortune 500 CISOs (chief information security officers), working with Chris, Spacewalk’s CPO, to help Spacewalk decide where its product should go next.
Spacewalk was winning with SOC teams (the analysts who watch for attacks) but struggling to turn meetings with CISOs, the executives who own the budget, into sales. Should the product move up to serve them?
6 weeks to answer itThe problem ↓ WHAT I DIDI designed the dashboard end to end in Figma, starting from CISO interviews the CPO had already recorded, then whiteboarded with the CPO and lead designer before designing anything.
2 Fortune 500 CISOsThe process ↓ WHAT HAPPENEDCISOs liked it but couldn't act on it. The gap was data and actionability, not design, so the CPO chose not to build it and kept Spacewalk focused on SOC operators.
1 product decisionThe outcome ↓
01 · The problem
Why weren't CISOs buying?
Spacewalk was built for the people who respond to incidents, not for the executive who has to defend a security budget to the board.
The CPO had a hypothesis: if the product gave CISOs security intelligence they could defend in front of a board, not just raw incident data, it could unlock enterprise budget.
That was untested. Before engineering spent time building it, the team needed a working prototype to put in front of real CISOs. Designing that prototype, and gathering feedback on it, was my job.
“People get tired of the CISO asking for money when they don't understand the problems we're trying to solve.”
— Jason, a former CISO we interviewed
I spent my first week learning the vocabulary: CIRT (the incident-response team), dwell time (how long an attacker goes unnoticed) and MITRE ATT&CK (a public catalog of attacker techniques). Then I could ask something more basic: what does a CISO actually need to see?
02 · Two readers, four questions
Two readers, four questions
Four questions, answered clearly, without a designer in the room to explain them.
Stakeholder interviews gave us two personas. Both are fictional, built from what we heard.
Needs to see the organization's true security risk at a glance, translate it into business value, and know which teams need more resources.
Needs to prove his team's operational efficiency to his boss: how fast they detect, how fast they escalate, and where they're improving.
See our “how might we” questions
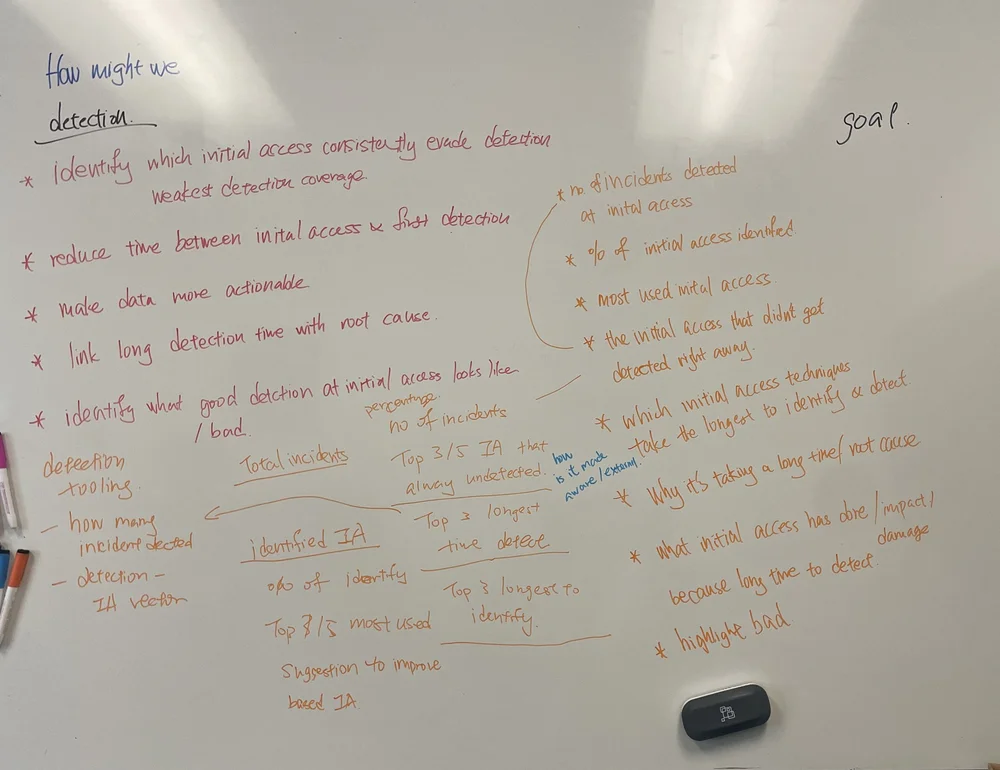 How might weClick to enlarge
- How might we…
- …identify which initial access techniques consistently evade detection?
- …reduce the time between initial access and first detection?
- …make the data more actionable?
- …link long detection times to their root cause?
- …show what good detection at initial access looks like?
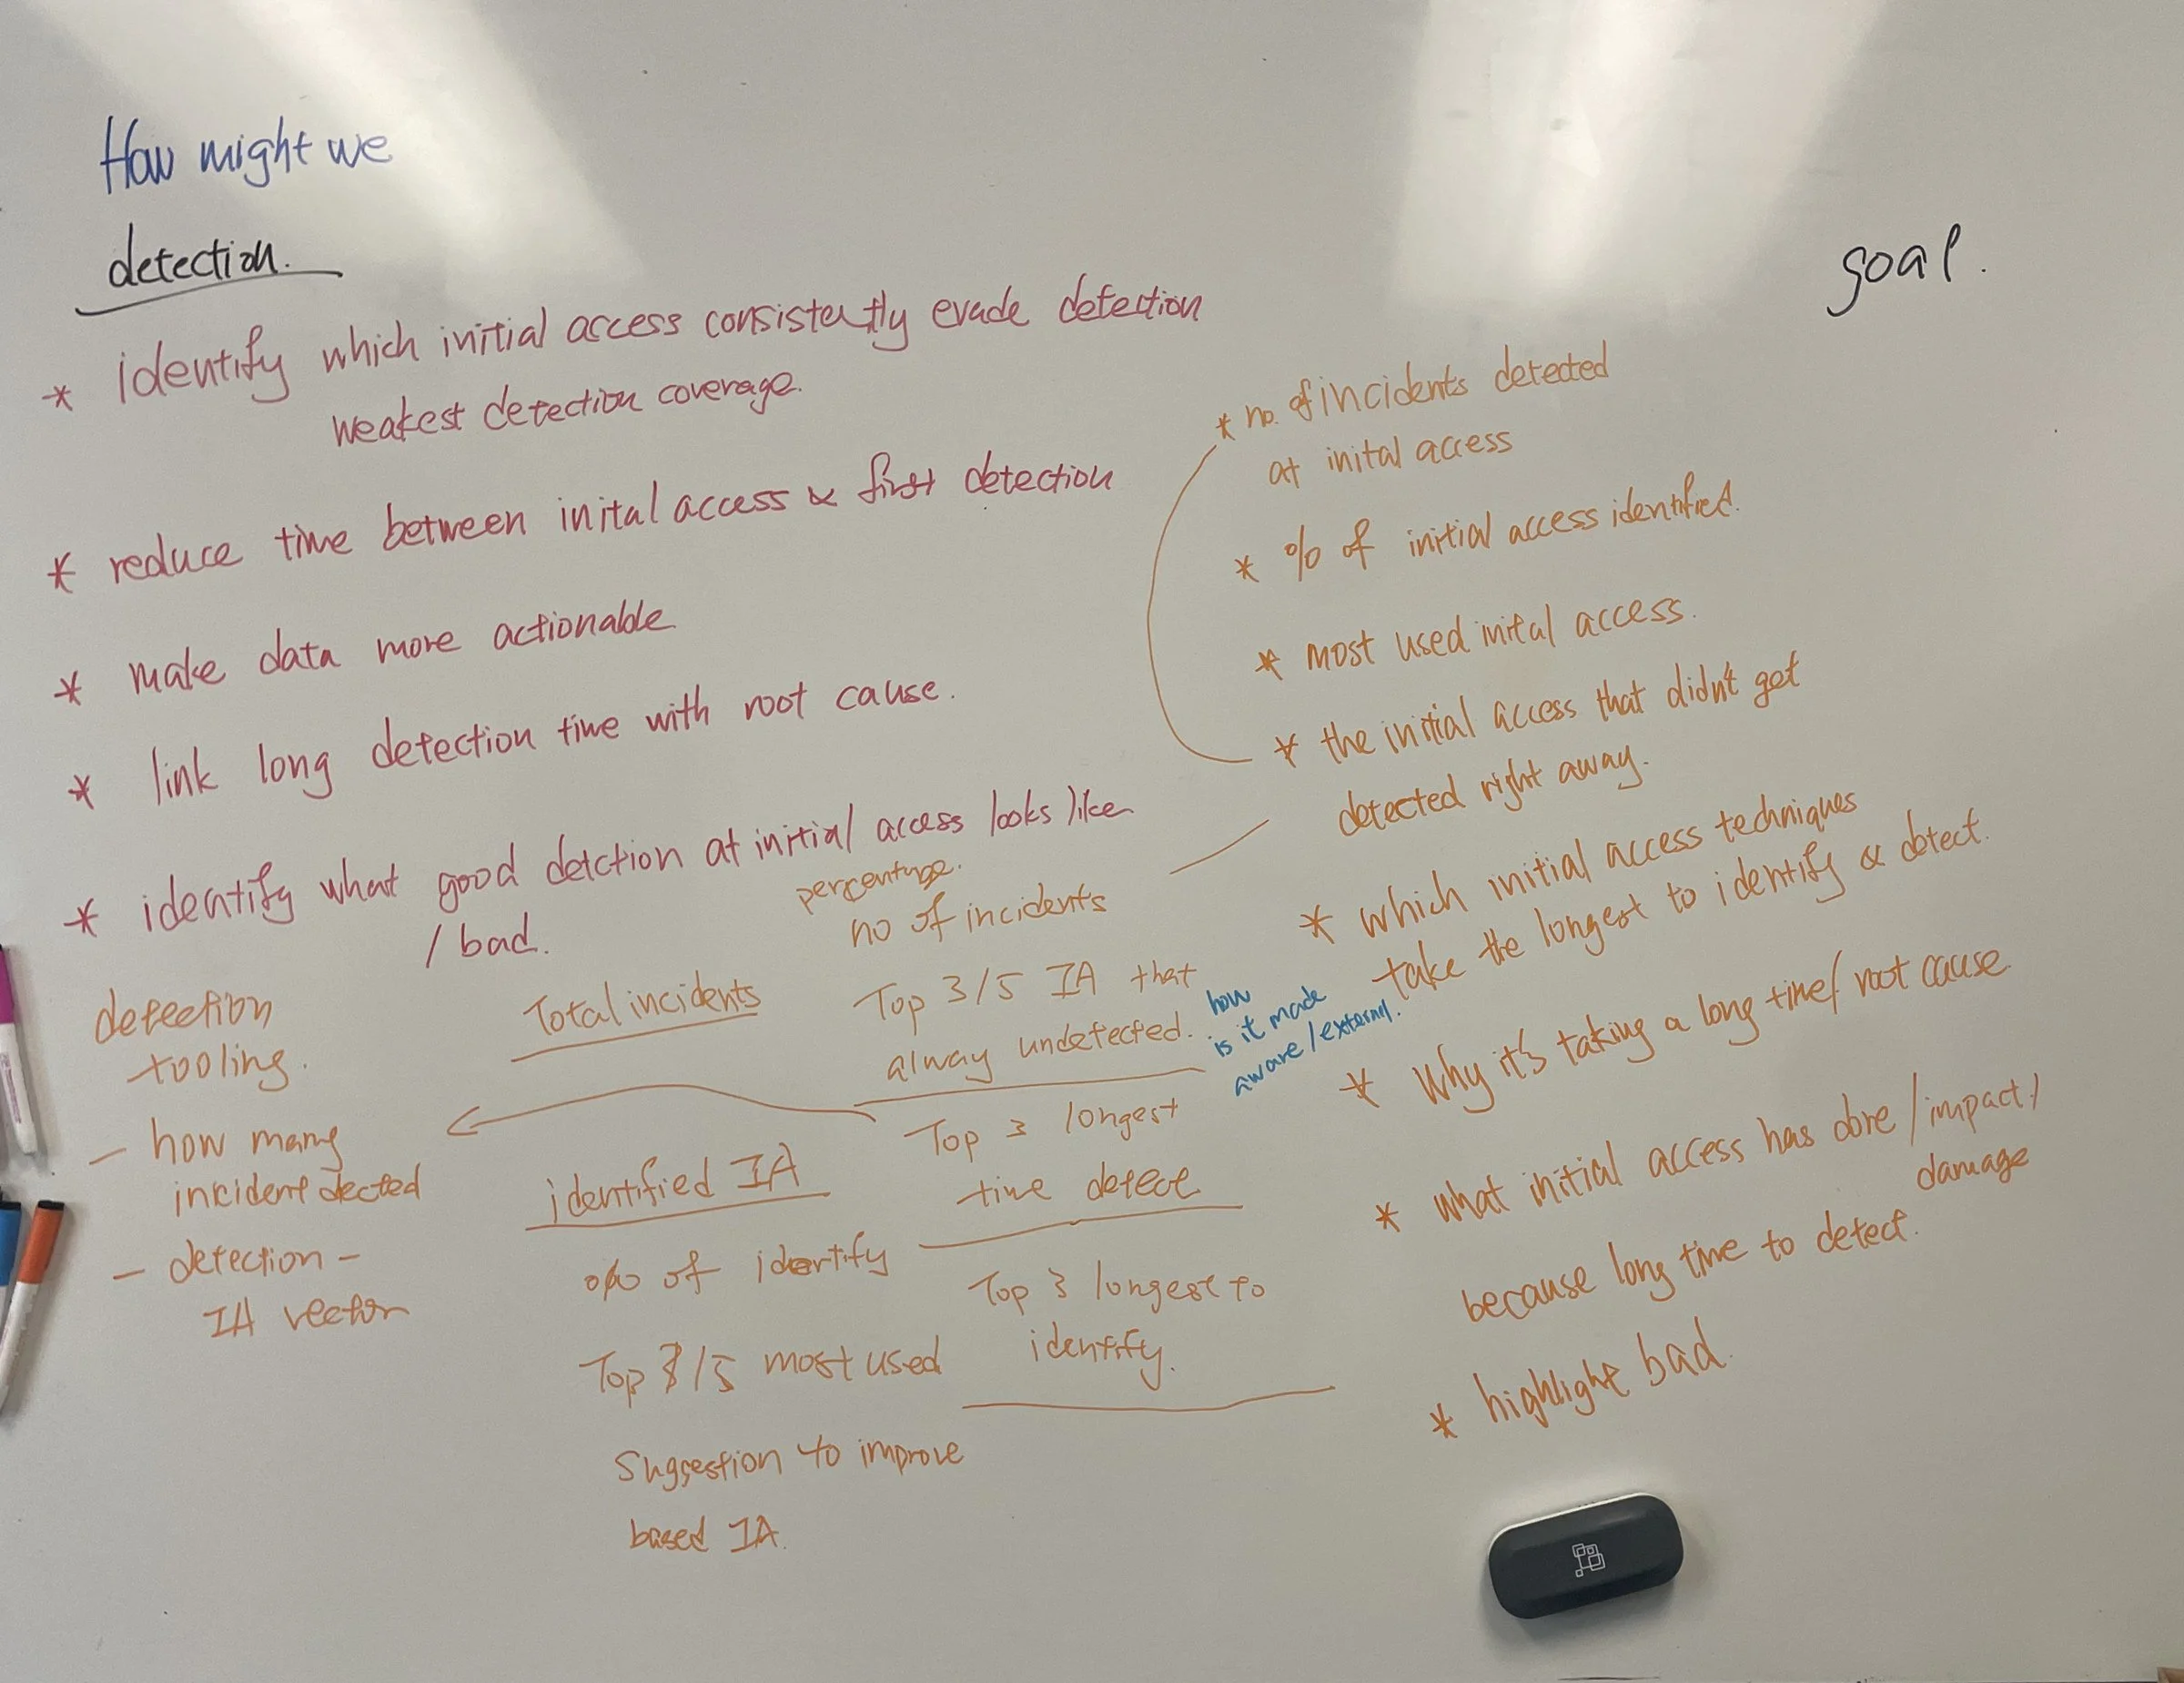
- The orange notes on the right became our goals: incidents caught at initial access, the most-used techniques, and the ones that took longest to detect.
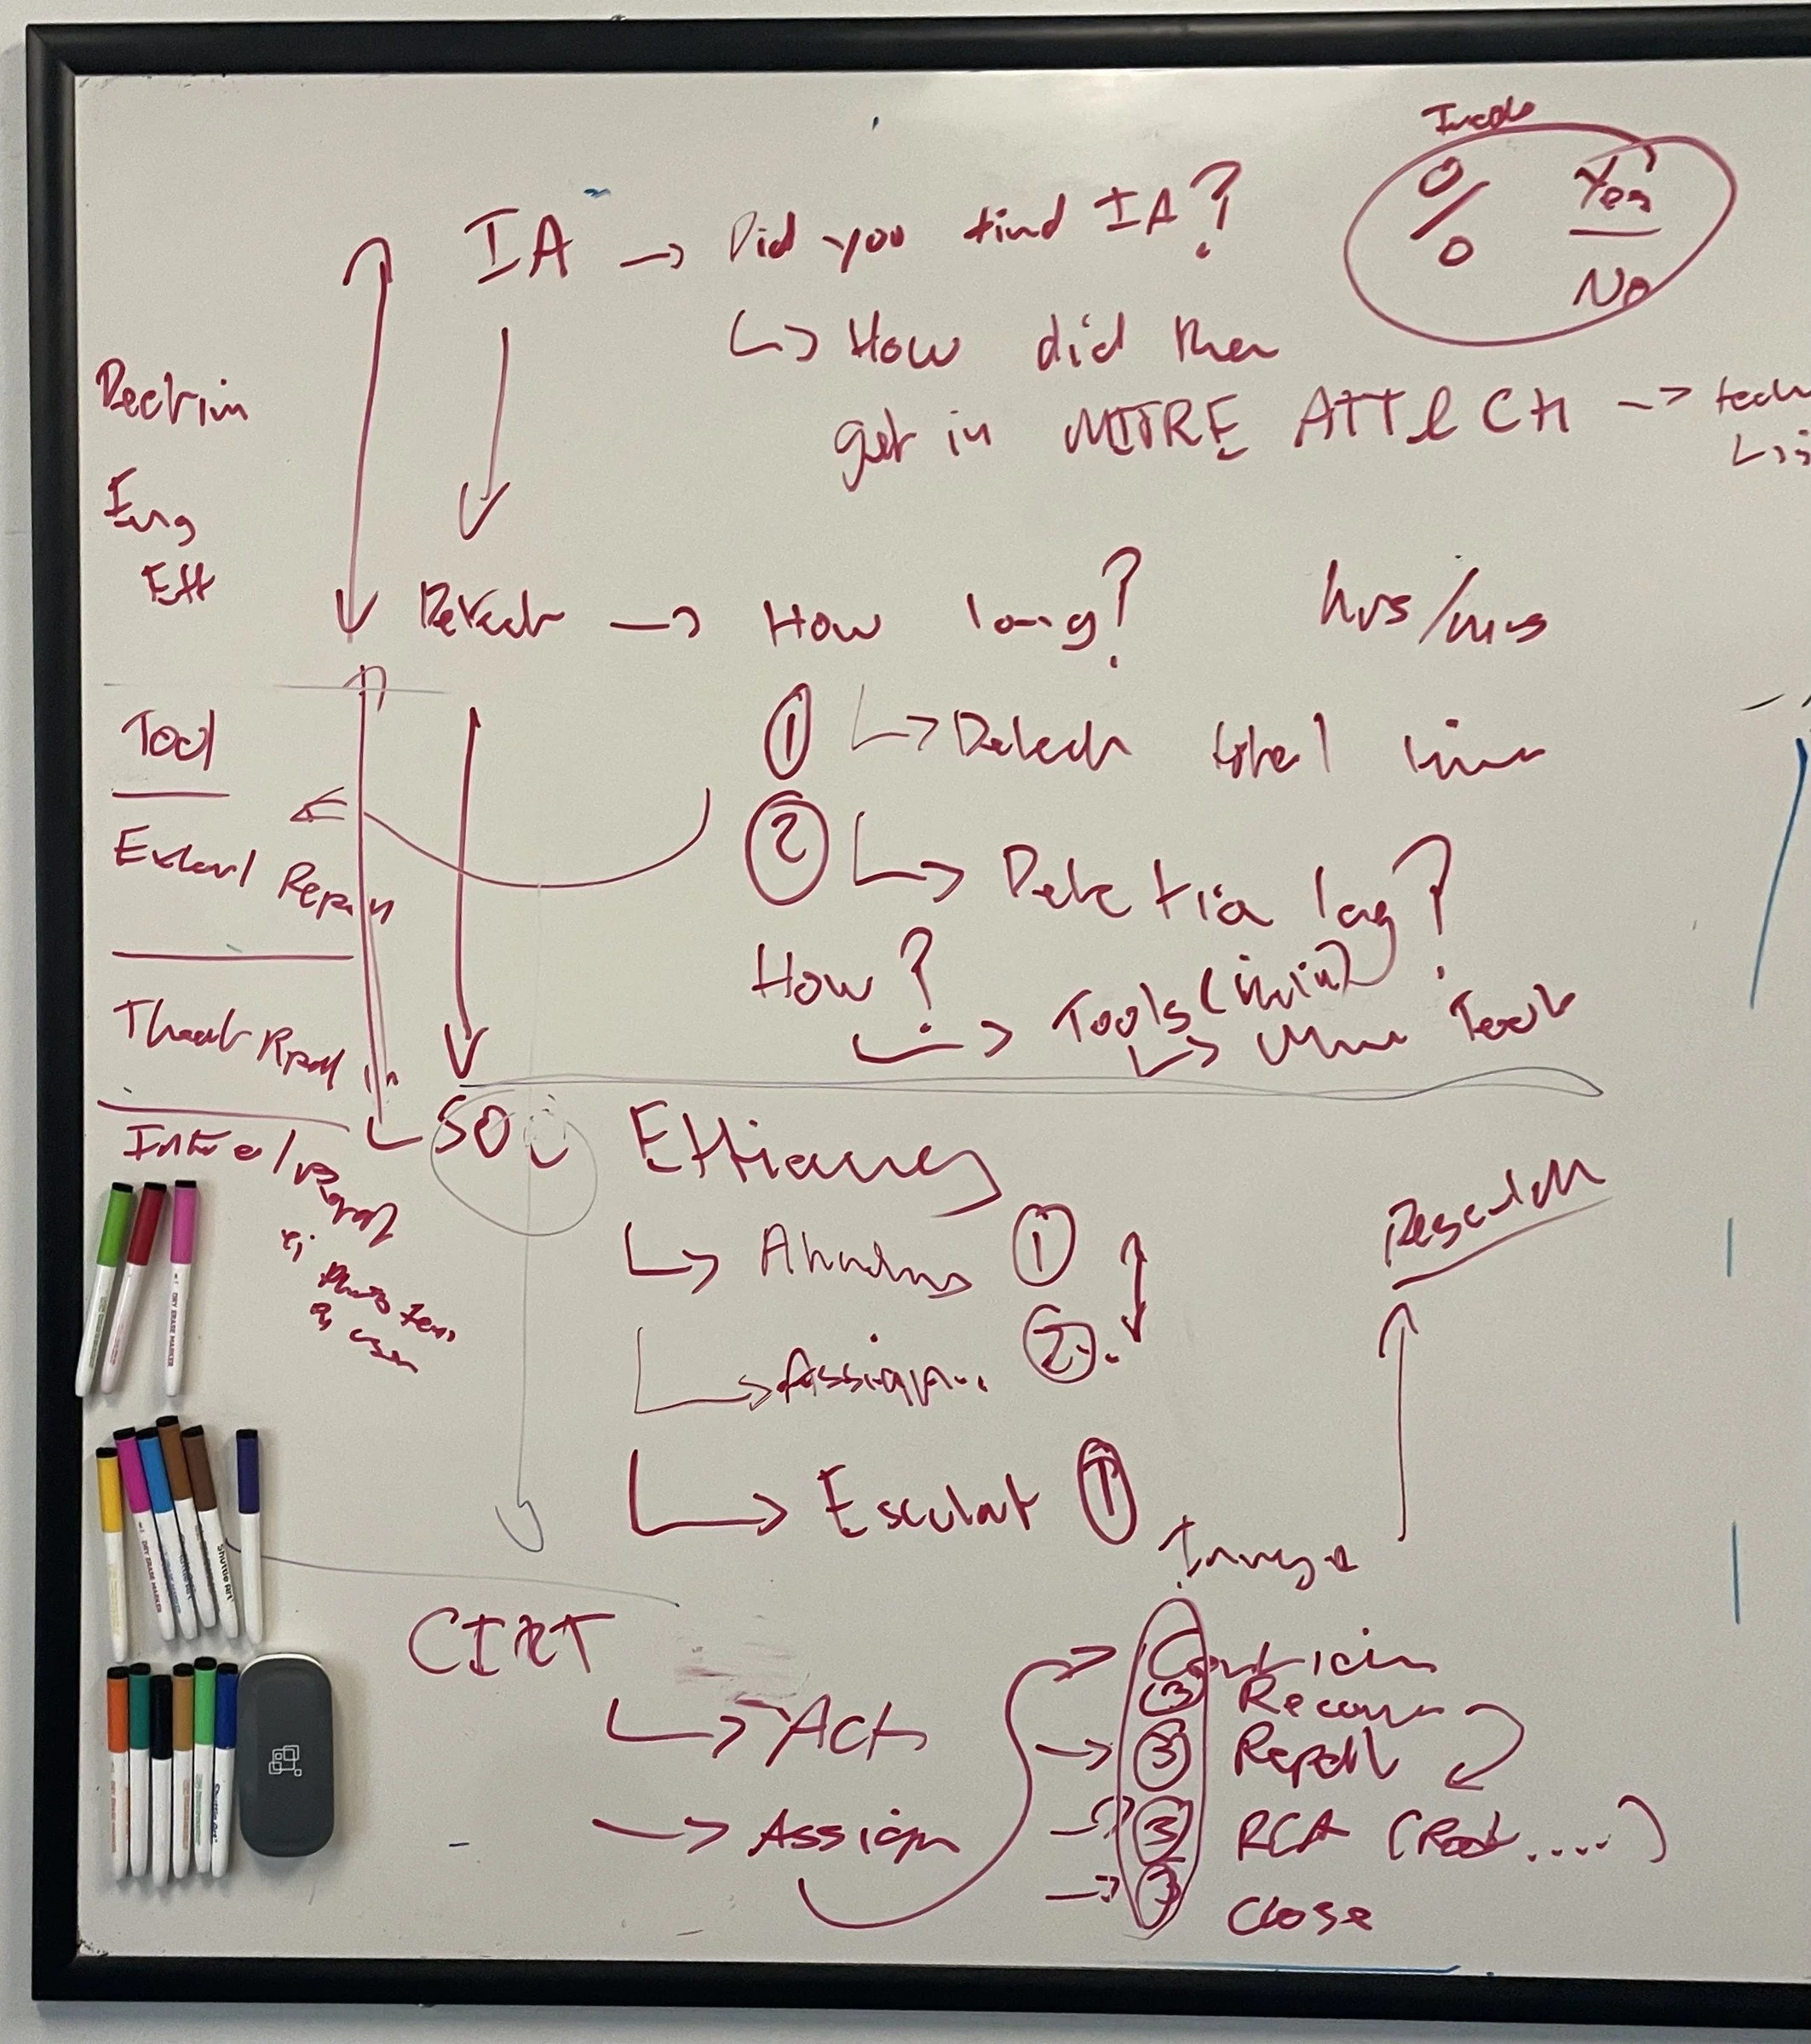
Their jobs were different, but their questions overlapped.
01Did we detect it?
Before anything else, a CISO needs to know whether their tools caught the attack at all, and how early. Catching it at initial access, the first stage, is the best case. The attacks that slip past are where the real risk is.
02How long did it take?
Every hour an attacker goes unnoticed means more damage. Time to detect is the largest part of dwell time, so it’s where the most time, and the most risk, is lost.
03How efficient was the SOC?
The SOC is the first line of response. CISOs told us they didn’t know which teams needed more resources, so they need to see whether alerts are acknowledged, assigned, and escalated quickly, or piling up in the handoffs.
04How efficient was the CIRT?
The CIRT contains the attack and writes the report. Its speed is how a CISO shows the response team is worth funding, one of the reasons we listed for why a CISO would open this dashboard at all.
These became the dashboard's information architecture: every metric sits under one of the four questions, instead of following the data schema underneath, which is how most security tools get built.
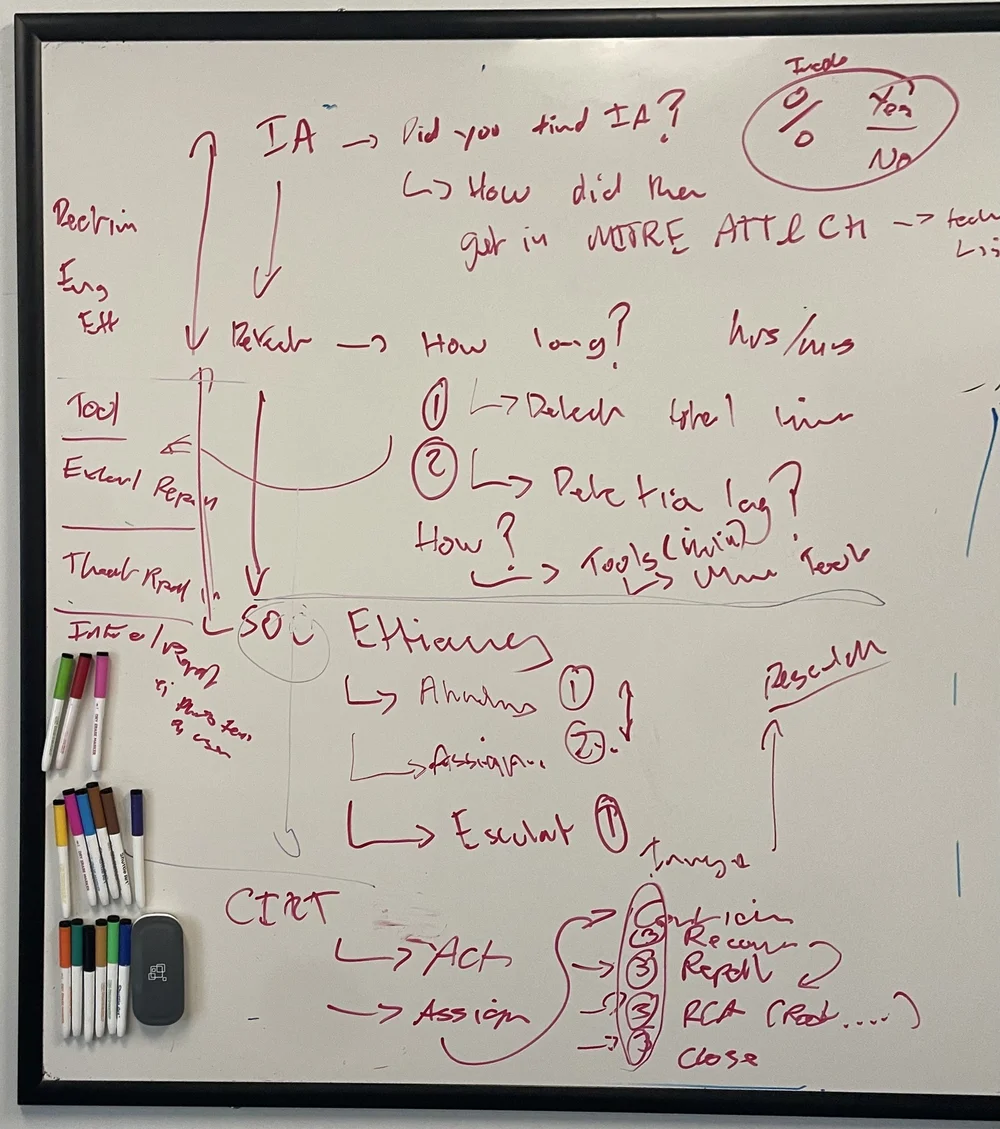 Question breakdownClick to enlarge
03 · Sketch, test, reframe
Sketch, test, reframe
We didn’t know what the answers should look like, so we sketched, built, tested, and revised.
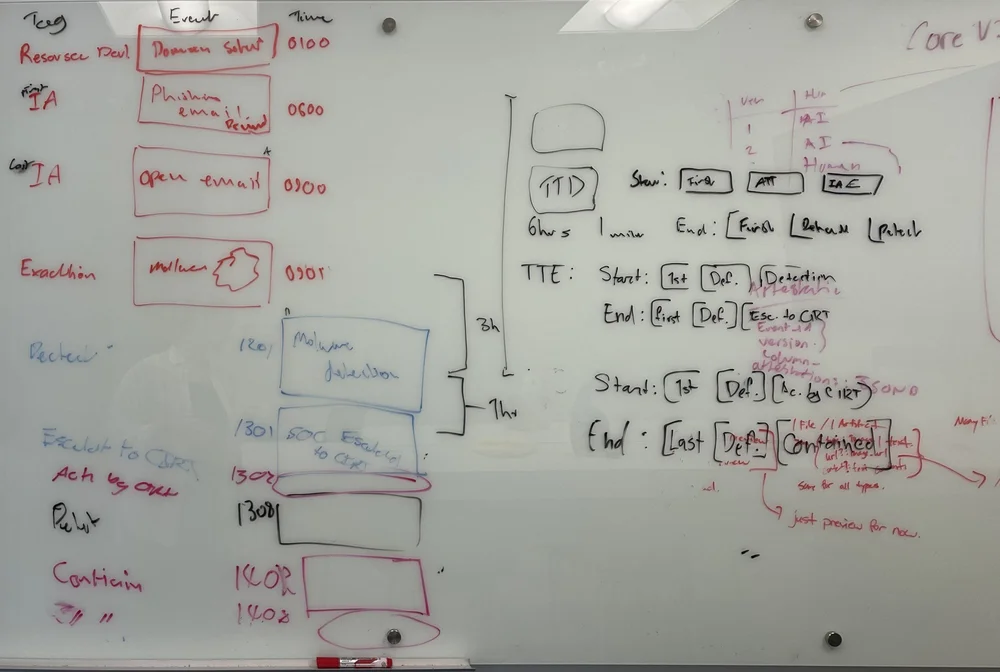
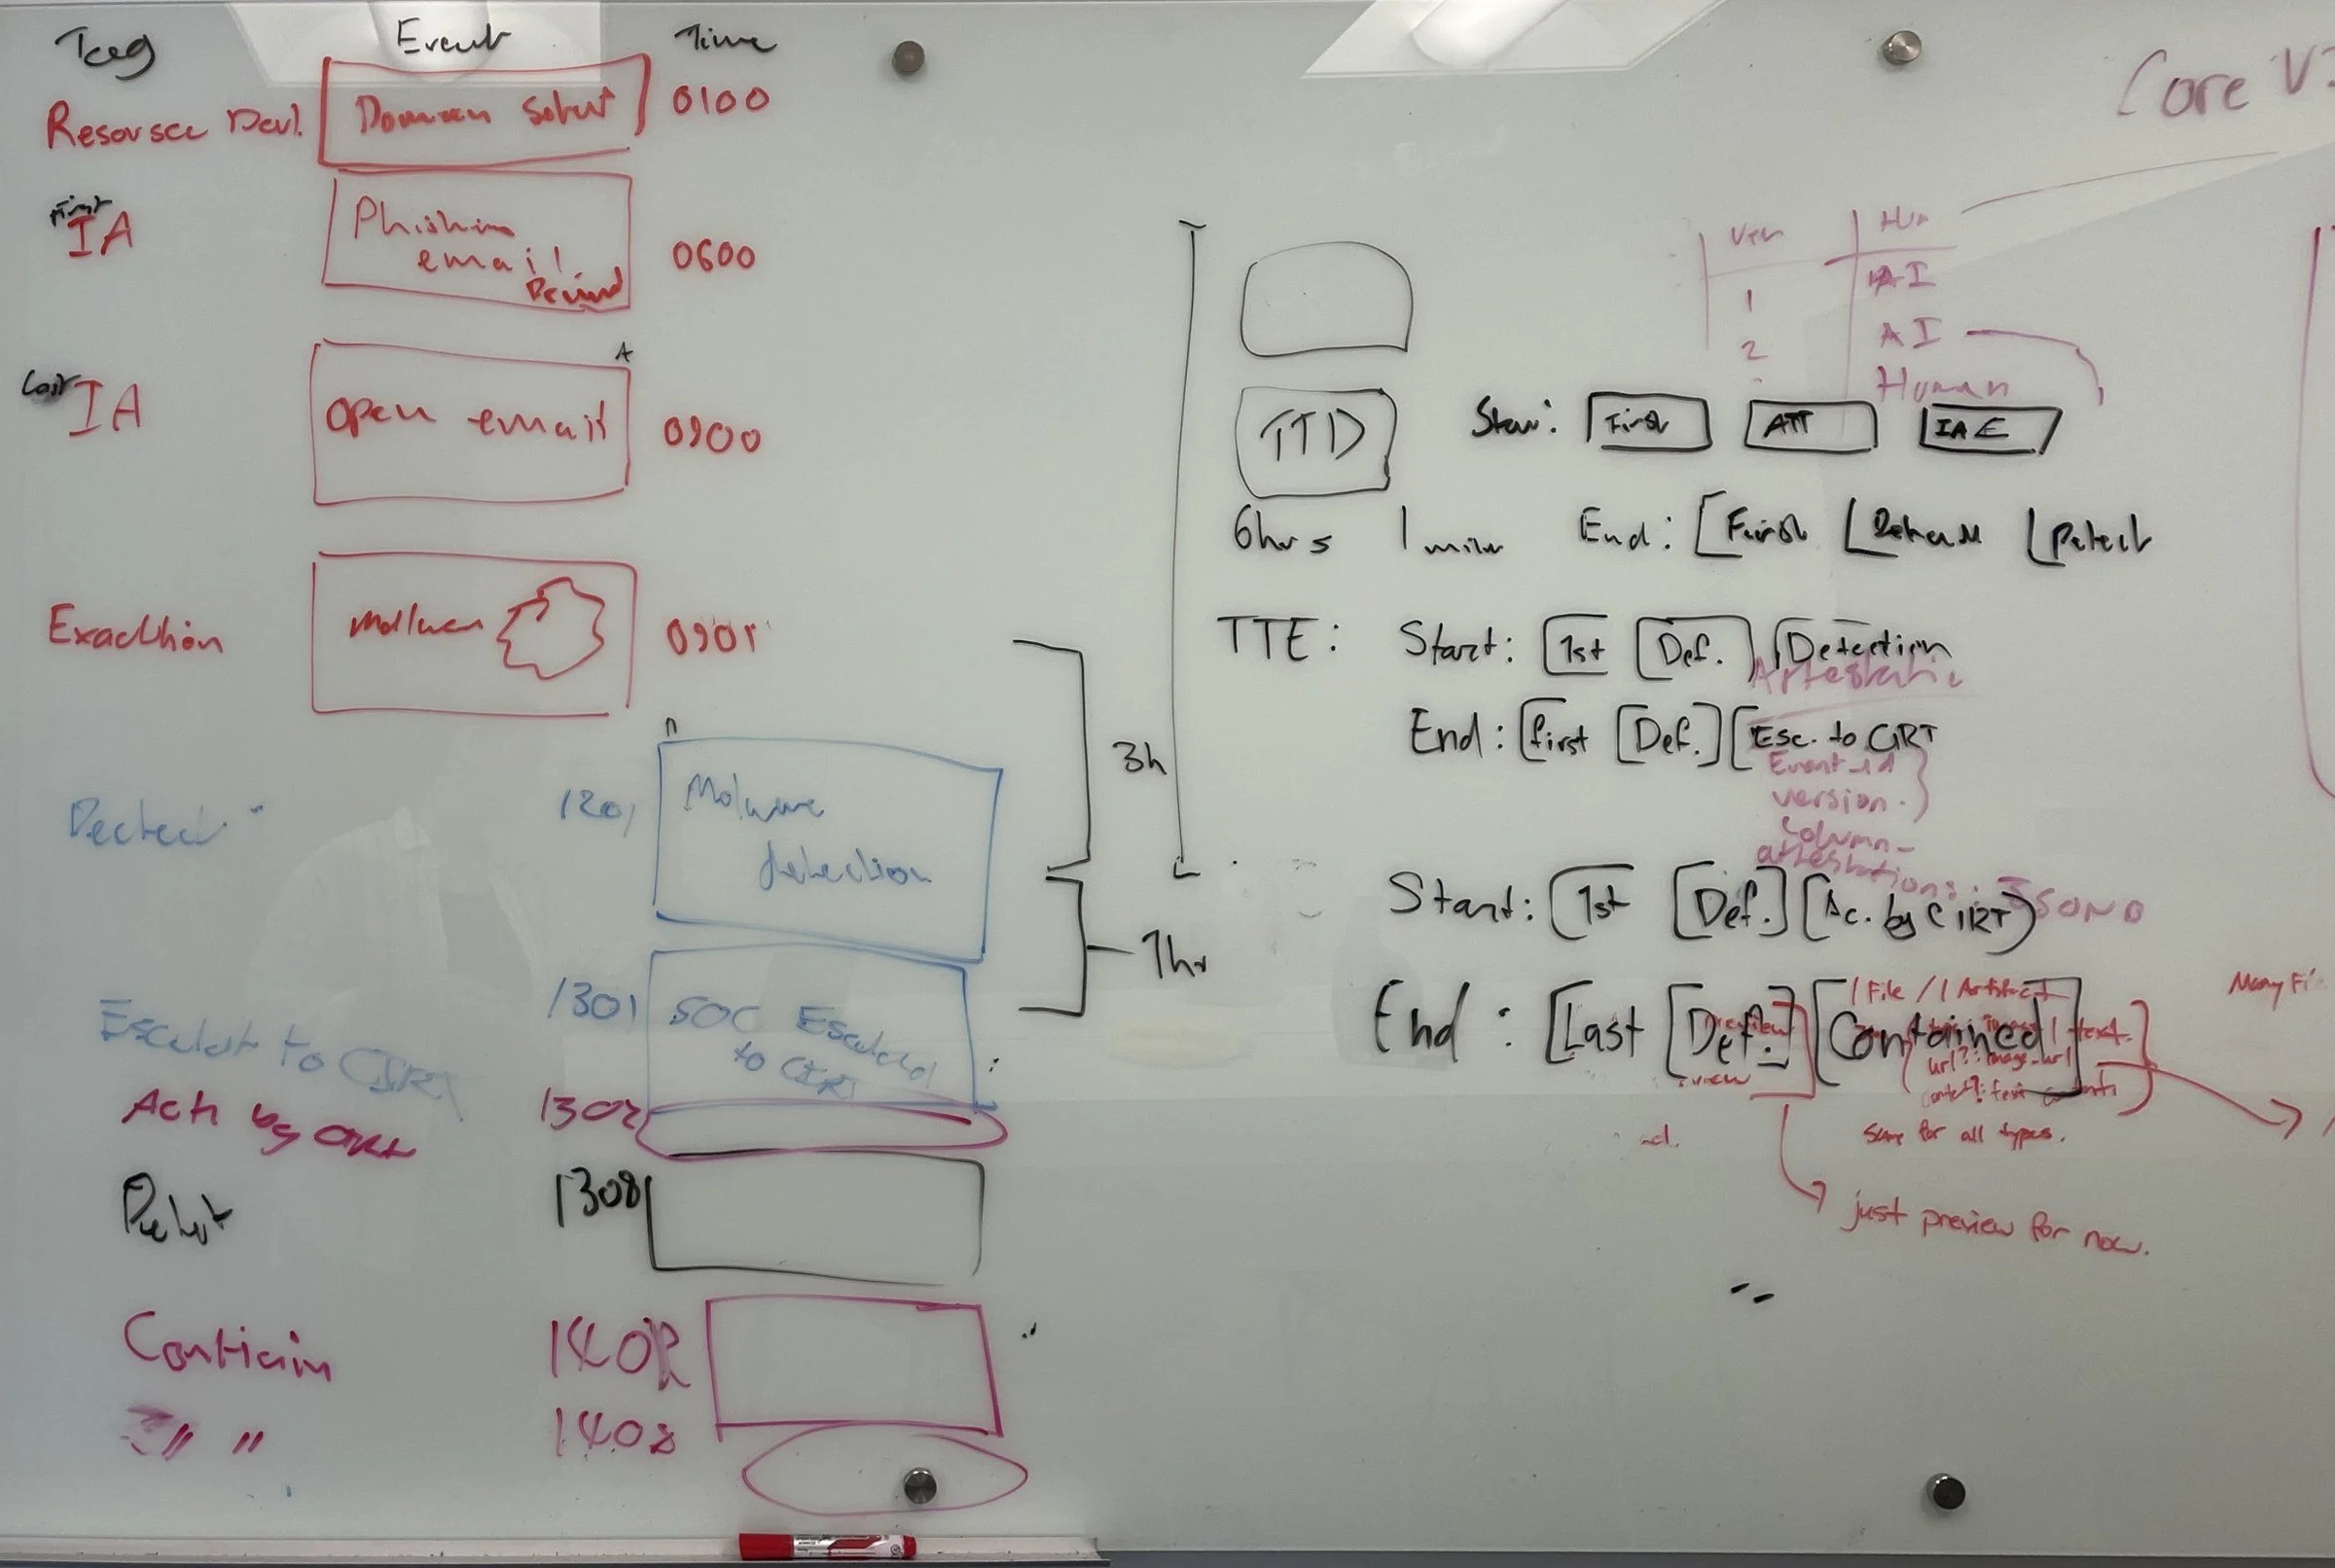
We sketched on whiteboards first, then built Iteration 1 in Figma. It got the structure right but lacked a clear visual hierarchy, so Iteration 2 rebuilt the page around total incidents, a dwell-time timeline and a risk table. That is the version the CPO, the lead designer and I took into four Zoom meetings with two Fortune 500 CISOs, walking them through it piece by piece. I observed and took notes while they led.


Cropped to the top of each screen. The changes were driven by feedback from the CPO, the lead designer and the CISOs.
What we heard, right where it applied.
Feedback came from four walkthroughs with two Fortune 500 CISOs, an IR practitioner who used the product hands-on, and an engineer’s first-glance review. Each number matches a quote. Mock-up simplified from Iteration 2.
- 1
“I can trust that metric.”
On total incidents
- 2
“I'm not quite sure how to read this.”
On the dwell-time row
- 3
“I like the callout to the MITRE ATT&CK framework.”
On the risk chart
- 4
“Would be nice if that was more explicit.”
On risk levels
Trust in the numbers was there. What the CISOs wanted was clearer grouping and more explicit risk, and those became the focus of the final round.
They took space in the wireframes without adding meaning.
Two decimals looked precise but were harder to trust at a glance.
The CISOs wanted risk to be explicit, so each technique got a clear status.
Showing the count behind the percentage made it easier to believe.
CISOs trusted the numbers. They couldn’t see the risk.
Where were attackers actually getting through? Midway through, the CPO pushed us to map detection onto the stages of an attack: where in the kill chain is an organization good at catching attackers, and how quickly?
That became the design’s signature view: the kill-chain chart in the final dashboard. The CPO showed it to a prospective client, who isn’t named here, and their reaction was immediate.
 Attack stagesClick to enlarge
04 · The dashboard
The dashboard, on one screen
Every metric grouped under the four questions it answers.
Try it: switch the dwell-time tabs, flip between SOC and CIRT, hover the ⓘ icons, and toggle light and dark mode.
Total incidents anchors the page, so it's the largest number on it.
One bar, marked with real milestones, shows where the hours go from first attack to containment.
Tooltips define specialist terms without cluttering the view for experts.
Dark for dim SOC rooms and long shifts, light for executive reviews.
Connect metrics to financial impact.
It was one of our three design principles. A CISO defending a budget needs to say what an incident costs the business, not just how many hours it lasted. But Spacewalk didn't have the data to calculate it, so it never made it onto the dashboard.
Looking back, it was the first sign of what testing would confirm: the gap was in the data, not the design.
05 · The outcome
Would CISOs buy it?
They liked it. They couldn’t act on it.
Across all four meetings, the reaction was consistent: CISOs liked seeing their organization this way. But every metric raised the same follow-up: so what do I do about it?
Answering that needed data infrastructure Spacewalk didn’t have yet, the same gap that kept financial impact off the dashboard, and a workflow that pointed the CISO’s team toward action. This was a data and actionability problem, not a design problem.
For a startup still finding product-market fit, that was the answer. The CPO chose not to build it, and Spacewalk doubled down on the SOC operators it was already serving well.
The answer was no, and that was still the right result. What would I carry forward?
Reflection
What would I carry forward?
Learn the world, design the action, and treat a no as an answer.
A dashboard that informs without directing isn't finished. Next time I'd start from what the user should do, then pick the metrics that support it.
Testing with real CISOs before engineering started saved the team from investing in the wrong bet.
I spent my first week learning cybersecurity before drawing anything. That’s how I saw the dashboard’s real reader: not just the CISO, but the board the CISO has to convince.